Physics of Capnography
There are five Physical methods
1. Infra-red Spectrography
2. Molecular Correlation Spectrography
3. Raman Spectrography
4. Mass Spectrography
5. Photoacoustic Spectrography
Infra Red Spectrography
CO2 absorbs Infra red light at 4.3 µm
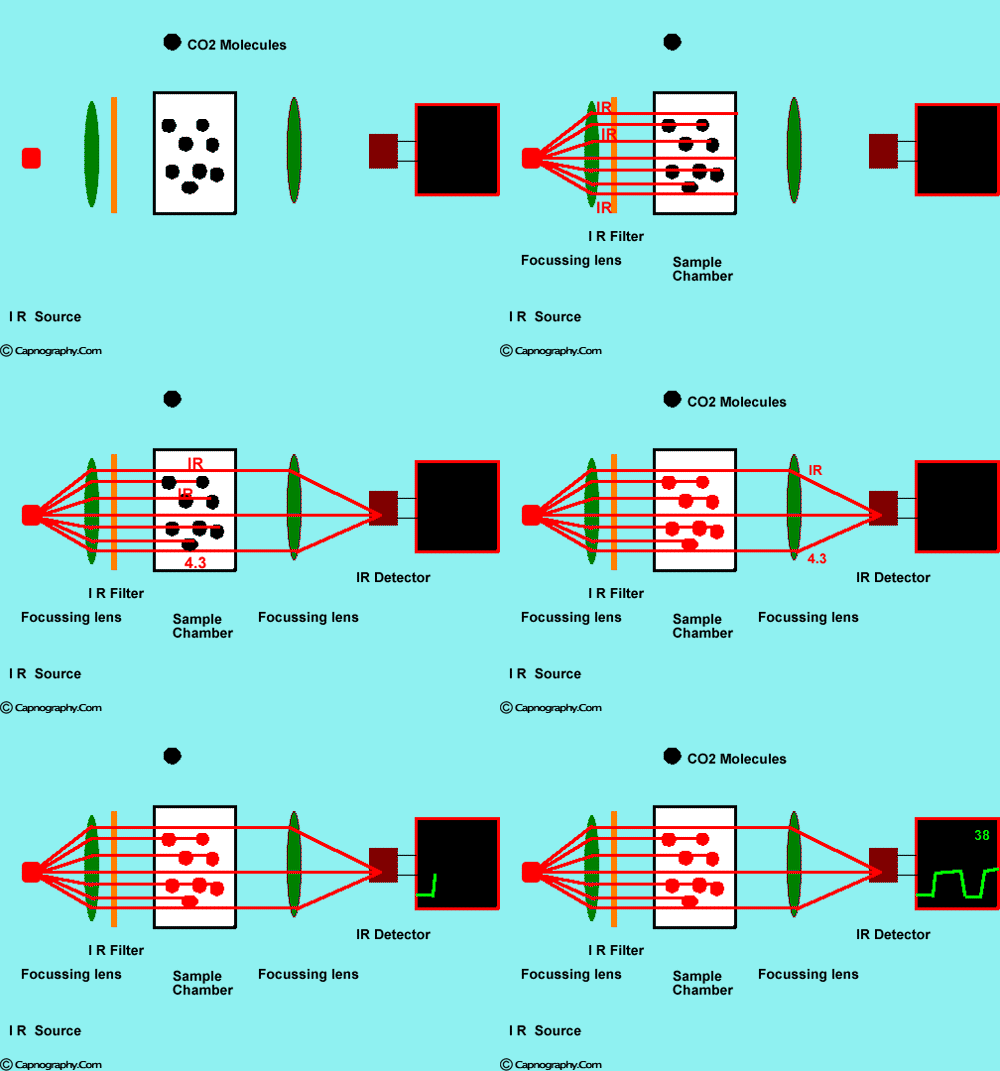
Infra-red spectrographs are more compact and less expensive than the other methods of measurement. This has been the most popular technique for monitoring C02. The wavelength of IR rays exceeds 1.0 milli micron while the visible spectrum is between 0.4 and 0.8 milli microns. The IR rays are absorbed by polyatomic gases (non-elementary gases such as nitrous oxide (N20), C02, and water vapour. Carbon dioxide selectively absorbs specific wavelengths (4.3 milli microns) of IR light. Since the amount of light absorbed is proportional to the concentration of the absorbing molecules, the concentration of a gas can be determined by comparing the measured absorbance with the absorbance of a known standard. The C02 concentration measured by the monitor is usually expressed as partial pressure in mmHg, although some units display percentage C02 (FC02), obtained by dividing C02 partial pressure by the atmospheric pressure.1,2
Molecular Correlation Spectrography (MCS)
Microstream technology is built on unique approach to IR radiation emission. Laser-based technology, i.e., molecular correlation spectroscopy (MCS), is used to generate an IR emission that precisely matches the absorption spectrum of CO2 molecule. The high emission efficiency and extreme CO2 specificity and sensitivity of the emitter-detector combination allows for an extremely short light path which allows the use of very small sample cell (15 µl). This in turn permits the use of a very low flow rate (50 ml/min) without compromising accuracy or responsive time. This is in contrast to conventional CO2 IR method, where the sampling flow rate is 150 ml/min.
Microstream technology uses a novel MCS source that operates at room temperature and emits only CO2 specific radiation (figure below, permission from Krauss B).3
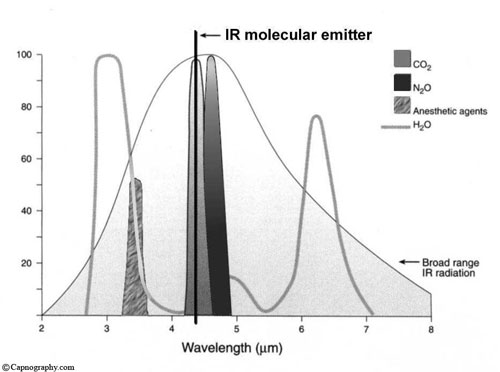
The source emits approximately one hundred discrete lines spread out in the 4.2 to 4.35 µm regions with a Boltzman distribution. The individual lines each have widths of 0.004 cm-1 while being separated from each other with the chracteristic CO2 spacing of 1 to 1.5 cm-1. The MCS source is therefore emitting extremely thin lines of radiation in the very narrow but discrete CO2 wavelengths without any superfluous radiation outside of these wavelengths. This results in a greater than 1 to 200 ration between line widths and the distance between the lines, which leaves large amounts of empty space free of radiation. This allows Microstream technology to eliminate any over-lap or interference with other gases.
The mechanism of MCS is:
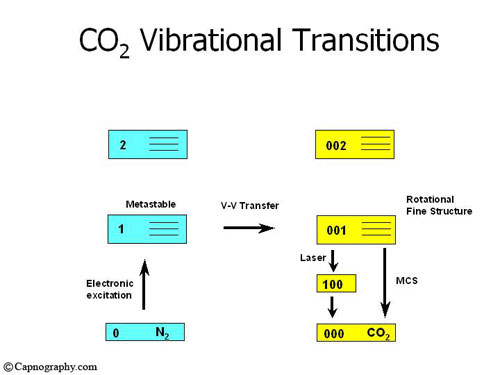
1. The source, unlike the black body IR radiator, is an all glass discharge lamp, without an electrode, coupled with an IR transmitting window which is either sapphire (for very high outputs and low noise) or high transmitting IR glass (for standard functions). The glass lamp undergoes a special cleaning process as well as chemical conditioning before being filled with a carefully balanced mixture of up to 7 gases at low pressure. Electrons generated by a radio frequency voltage excite Nitrogen molecules, one of the gases within the source.
2. Carbon dioxide molecules are then excited through collision with the excited nitrogen molecules as energy is transferred from Nitrogen to the CO2 molecules. As the excited CO2 molecules drop back to their ground state they emit signature wavelength of CO2, which is the radiation emitted from the source (see figure below, permission from Krauss B).3
Molecular correlation spectroscopy signal processing:
The IR source is electronically modulated at a frequency of 20 Hz so that a measurement can be sampled every 25 msecs. This preserves a rapid response time while maintaining optimal signal characteristics without degradation. The amplitude of each signal received by the detector is dependent on the amount of radiation absorbed from the gas sample that is proportional to the CO2 concentration. The signals from the optical detector are amplified and frequency locked before being delivered for peak to peak sampling with 12 BIT A to D converter. This provides a 25 msec periodic voltage signal, reflecting the level of CO2 absorption. These voltages are then transformed to CO2 concentrations using the anticipated absorption curves for the instantaneous ambient conditions. Because of the highly specific nature of the MCS source, the exponential shaped absorption curves are very deep (see figure below, permission from Krauss B).3
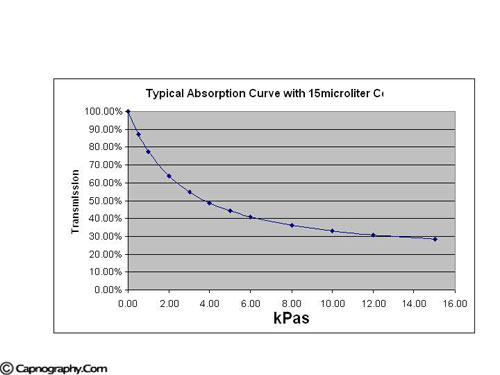
In a gas sample with a concentration of 5% CO2, absorption greater than 50% of the source emitted radiation occurs using the standard 15 µl cell. At concentration of 10% CO2, absorption of more than 65% can be expected. As a result of the high sensitivity and specificity of MCS absorption characteristic exponential shape of the MCS absorption curve, the low concentration regions demonstrate large changes of absorption and therefore changes in signal. This phenomena is present even for small variances in CO2 concentration and provides high signal to noise characteristics in the final displayed waveform.
To further enhance the waveform signal to noise, without affecting the response time, dynamic averaging of the 25 msec signal is used. The degree of dynamic averaging is proportional to the rate of change of the signal. In this method, only with slow changing signals, indicative of the alveolar CO2 plateau or the inhalation phase, is averaging applied. When fast changing signals are detected, indicative of the ascending CO2 upstroke, all signal averaging is removed.
Microstream employs a flow rate of 50 ml/min, one-half to one-third the rate typically required by conventional side-stream capnographs. It has been suggested that the low flow rate reduces the entry of moisture and humidity that can condense in the sampling line and obstruct the sample pathway – a common problem with conventional side-stream technology.3 The low flow rate also maintains accuracy while eliminating the competition for tidal volume, common with high flow rate capnographs in infants and neonates. A flow rate as low as 50 ml/min was not generally provided with previous capnographs since it had a detrimental effect on response time., the ability to address rapid respiratory rates, and the ability to measure CO2 accurately without mixing.
For further details on this technology, refer reference #3.
Raman Spectrography
Raman Spectrography uses the principle of “Raman Scattering” for CO2 measurement. The gas sample is aspirated into an analyzing chamber, where the sample is illuminated by a high intensity monochromatic argon laser beam. The light is absorbed by molecules which are then excited to unstable vibrational or rotational energy states (Raman scattering). The Raman scattering signals (Raman light) are of low intensity and are measured at right angles to the laser beam. The spectrum of Raman scattering lines can be used to identify all types of molecules in the gas phase. Raman scattering technology has been incorporated into many newer anesthetic monitors (RASCAL monitors) to identify and quantify instantly CO2 and inhalational agents used in clinical practice.4
The mass spectrograph separates molecules on the basis of mass to charge ratios. A gas sample is aspirated into a high vacuum chamber (10-5 mmHg) where an electron beam ionizes and fragments the components of the sample. The ions are accelerated by an electric field into a final chamber, which has a magnetic field, perpendicular to the path of the ionized gas stream. In the magnetic field the particles follow a path wherein the radius of curvature is proportional to the charge:mass ratio. A detector plate allows for determination of the components of the gas and for the concentration of each component. Mass spectrometers are quite expensive and too bulky to use at the bedside and are rarely used presently. They are either “stand alone,” to monitor a single patient continuously, or “shared,” to monitor gas samples sequentially from several patients in different locations (multiplexed). Up to 31 patients may be connected to a multiplexed system and the gas is simultaneously sampled from all locations by a large vacuum pump. A rotary valve (multiplexer) is used to direct the gas samples sequentially to the mass spectrometer. In a typical 16-station system, with an average breathing rate of 10 breaths min-l, each patient will be monitored about every 3.2 min. The user can interrupt the normal sequence of the multiplexer and call the mass spectrometer to his patient for a brief period of time.1,5
Photoacoustic gas measurement (e.g., Bruel-Kjaer gas monitor)is based on the same principles as conventional IR-based gas analyzers: the ability of CO2 and N20 and anaesthetic agents to absorb IR light. However, they differ in measurement techniques. While Infra-red spectrography uses optical methods, PAS uses an acoustic technique. When an IR energy is applied to a gas, the gas will expand and lead to an increase in pressure. If the applied energy is delivered in pulses the gas expansion would be also pulsatile, resulting in pressure fluctuations. If the pulsation frequency lies within the audible range, an acoustic signal is produced and is detected by a microphone. Potential advantages of PAS over IR spectrometry are higher accuracy, better reliability, less need of preventive maintenance, and less frequent need for calibration. Further, as PAS directly measures the amount of IR light absorbed, no reference cell is needed and zero drift is nonexistent in PAS. The zero is reached when there is no gas present in the chamber. If no gas is present there can be no acoustic signal.6 Despite being a superior method of measurement of CO2, photoacoustic spectrography did not gain as much popularity as IR spectrography.
References:
1. Kalenda Z. Mastering Infrared Capnography. The Netherlands: Kerckebosch-Zeist, 1989.
2. Carbon dioxide monitors. Health Devices 1986;15:255-85.
3. Colman Y, Krauss B. Microstream capnography technology: A new approach to an old problem. J Clin Monit 1999;15:403-9.
4. Tremper KK, Barker SJ. Fundamental principles of monitoring instrumentation. In: Miller RD (ed.). Anesthesia Vol I. 3 rd ed. New York: Churchill Livingstone, 1990:957-99.
5. Raemer DB, Philip JH. Monitoring anesthetic and respiratory gases. In : Blitt CE (Ed.). Monitoring in Anesthesia and Critical Care Medicine. 2nd edition. New York: Churchill Livingstone, 1990:373-86.
6. Mollgaard K. Acoustic gas measurement. Biomedical Instrumentation and Technology 1989;23:495-7.

 Twitter
 Youtube


