Capnography In “Outside of Hospital Settings” – 911
Physiologically, CO2 produced in the tissues and diffuse into the venous blood which reaches the right side of the heart and reaches the lungs via pulmonary circulation. Here oxygen (O2) enters the blood and carbon dioxide (CO2) is given out which is eliminated during expiration.Capnography In “Outside of Hospital Settings” – 911
Venkatesh Srinivasa MD & Bhavani Shankar Kodali MD
Physiologically, carbon dioxide produced in the tissues and diffuse into the venous blood which reaches the right side of the heart and reaches the lungs via pulmonary circulation. Here oxygen (O2) enters the blood and carbon dioxide (CO2) is given out which is eliminated during expiration.
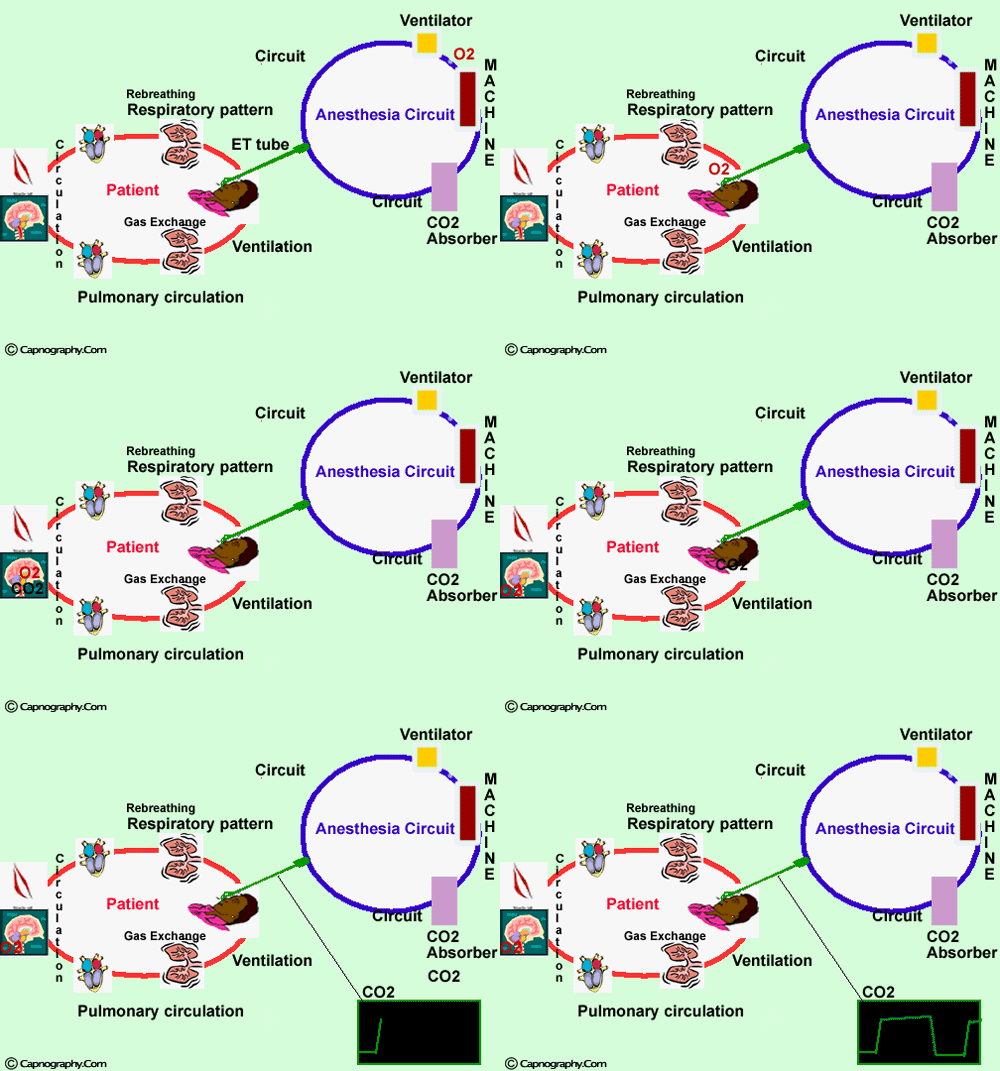
The measurement of C02 in the expired air directly indicates changes in the elimination of C02 from the lungs. Indirectly, it indicates changes in the production of C02 at the tissue level and in the delivery of C02 to the lungs by the circulatory system. Therefore, capnography constitutes an important non-invasive technique that can monitor C02 production, pulmonary perfusion and alveolar ventilation as well as respiratory patterns.
‘Basic Physiology of capnography’
For understanding basic physiology of capnography- Click here. It opens a new window. Close the window to return back to this page.
Current terminology is summarized as follows.
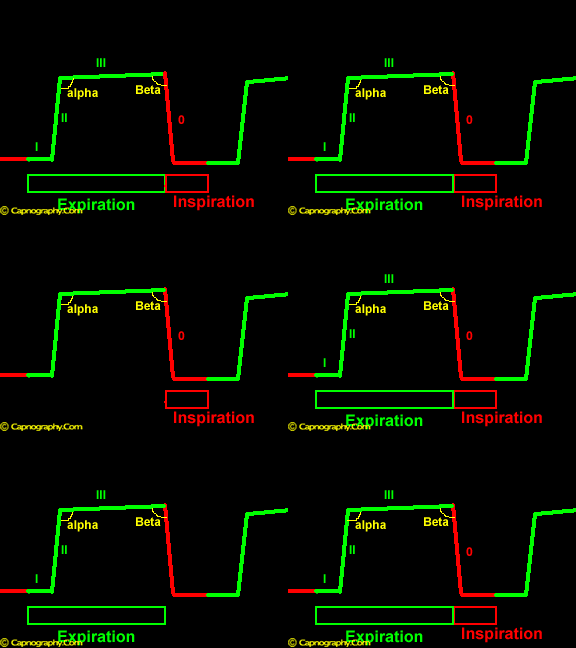
A time capnogram can be divided into inspiratory (phase 0) and expiratory segments. The expiratory segment, similar to a single breath nitrogen curve or single breath C02 curve, is divided into phases I, II and III, and occasionally, phase IV, which represents the terminal rise in C02 concentration. The angle between phase II and phase III is the alpha angle. The nearly 90 degree angle between phase III and the descending limb is the beta angle. For details refer to terminology section of the website.
End-tidal carbon dioxide tension (PETCO2):
As explained in the physiology section, the C02 concentration reaches a maximum at the end of exhalation. This maximum concentration is called end-tidal carbon dioxide concentration or tension depending on whether it is expressed in fractional concentration or mm Hg. End-tidal carbon dioxide reflects C02 concentration of alveoli emptying last. The normal values of ETCO2 is around 5% or 35-37 mm Hg. The gradient between the blood C02 (PaCO2) and exhaled C02 (end tidal CO2 or PetCO2) is usually 5-6 mm Hg. PetCO2 can be used to estimate PaCO2 in patients with essentially normal lungs.
Measurement of exhaled carbon dioxide:
The exhaled C02 (end-tidal C02) is detected/ measured by various devices – Colorimetry, capnometry, capnography. When C02 is absent as measured by these devices, it means either the endotracheal tube is in a wrong position (esophageal) or there is an absent/ decreased presentation of C02 to the lungs as in a cardiac arrest . When cardiac output increases (e.g. After resuscitation), PetC02 provides information about adequacy of ventilation and circulation (3).
Colorimetry:
To understand colorimetric measurement of carbon dioxide, click here It opens a new window. Close the window to return to continue with this section.
As explained in the above section, the chemical device provides continuous, semiquantitative EtC02 monitoring. This device has 3 color ranges
A- Purple — EtCO2 < 0.5%
B- Tan — EtCO2 0.5-2%
C- Yellow – EtCO2 >2%
Normal EtCO2 is > 4% hence the device should turn yellow when endotracheal tube is inserted in patients with intact circulation. Limitations of this device
1. It is a useful device to confirm endotracheal tube placement in patients not in cardiac arrest. In patients with cardiac arrest, a value of <0.5% EtCO2, the device is virtually of no use in confirming the endotracheal tube, because the tube could be in the esophagus or that the circulation is not bringing enough CO2 to the lungs. In non-arrest patients the device is 100% sensitive, while it is 69% in patients with cardiac arrest (4).
2. The membrane can turn ‘yellow’ (implies EtCO2 > 2%) when the device is contaminated with acidic substances like gastric acid, Lidocaine-HCl, epinephrine HCl.
3. The device is unable to give a reading if it is clogged with secretions, or the device broken.
Capnography and Capnometry:
These devices provide both waveform (capnograph) and digital read out of end-tidal CO2. The digital read out of ETCO2 can be in mm Hg (partial pressure of C02 in exhaled gas) or as % in exhaled gas. Most of the commonly used devices use ‘infra red absorption of CO2’ as principle of operation.
For understanding physics behind capnography, click here to open a new window. Close the window to return to this section.
They can be main stream or side stream (as described in the physiology section).
Applications of capnography out of hospital settings:
Endotracheal intubation:
When CO2 is absent as measured by above devices, it means either the endotracheal tube is in a wrong position (esophageal) or there is an absent/ decreased presentation of CO2 to the lungs as in a cardiac arrest . When cardiac output increases (e.g. After resuscitation), PetCO2 provides information about adequacy of ventilation and circulation (3).
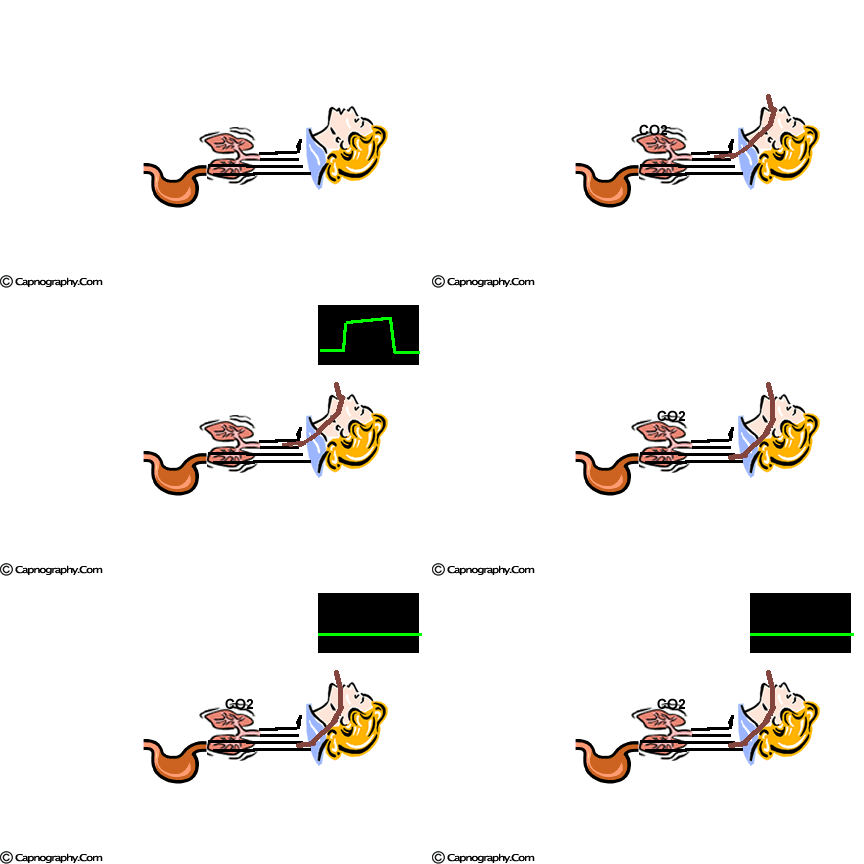
Endo tracheal intubation is performed in various clinical situations like respiratory failure, cardiac arrest, coma etc. It is associated with complications, but none is more catastrophic than inadvertent esophageal intubation. Correct placement of the endotracheal tube is suggested by, but not confirmed by the following methods.
Bilateral, equal breath sounds.
Bilateral chest wall movements.
No breath sounds/ gurgling over the stomach/ epigastrium.
Fogging of the endotracheal tube.
Tube/ cuff palpation in the neck.
Disappearance of cyanosis or improvement of patients color.
None of the above methods can provide a ‘fool-proof’ confirmation of endotracheal tube placement. This is illustrated be the statement “ even a conscientious, careful anesthesiologist may be unable to differentiate tracheal from esophageal intubation by commonly employed methods (1). Stewart et al (2) attribute 1.8% complication rate for esophageal intubation in a study of intubation by paramedics.
A normal looking waveform and a ‘digital read out’ confirms that the endotracheal tube is in trachea. In low cardiac output states like shock, cardiac arrest or inadequate chest compressions, PetCO2 may not be detected. If a patient has had carbonated beverages (5) or if mouth to mouth ventilation has been attempted, CO2 may be detected after esophageal intubation (false positive). The EtCO2 should rapidly decrease to zero (within 3-6 breaths) in this situation and also the wave form will not be ‘Normal’ looking. Vukmir et al (6) reported a sensitivity and specificity of 100% for endotracheal tube localization by capnography.
Esophageal intubation

Role in CPR:
The relationship between cardiac output and EtCO2 is logarithmic (3). Decreased presentation of CO2 to the lungs is the major rate limiting determinant of the EtCO2 during low flow. White R.D. et al (7) used EtCO2 measurement in out-of hospital cardiac arrest. They concluded that capnography can detect the presence of pulmonary blood flow even in the absence of major pulses (pseudo-electromechanical dissociation- EMD) and also can rapidly indicate changes in pulmonary blood flow (cardiac output) caused be alterations in cardiac rhythm.
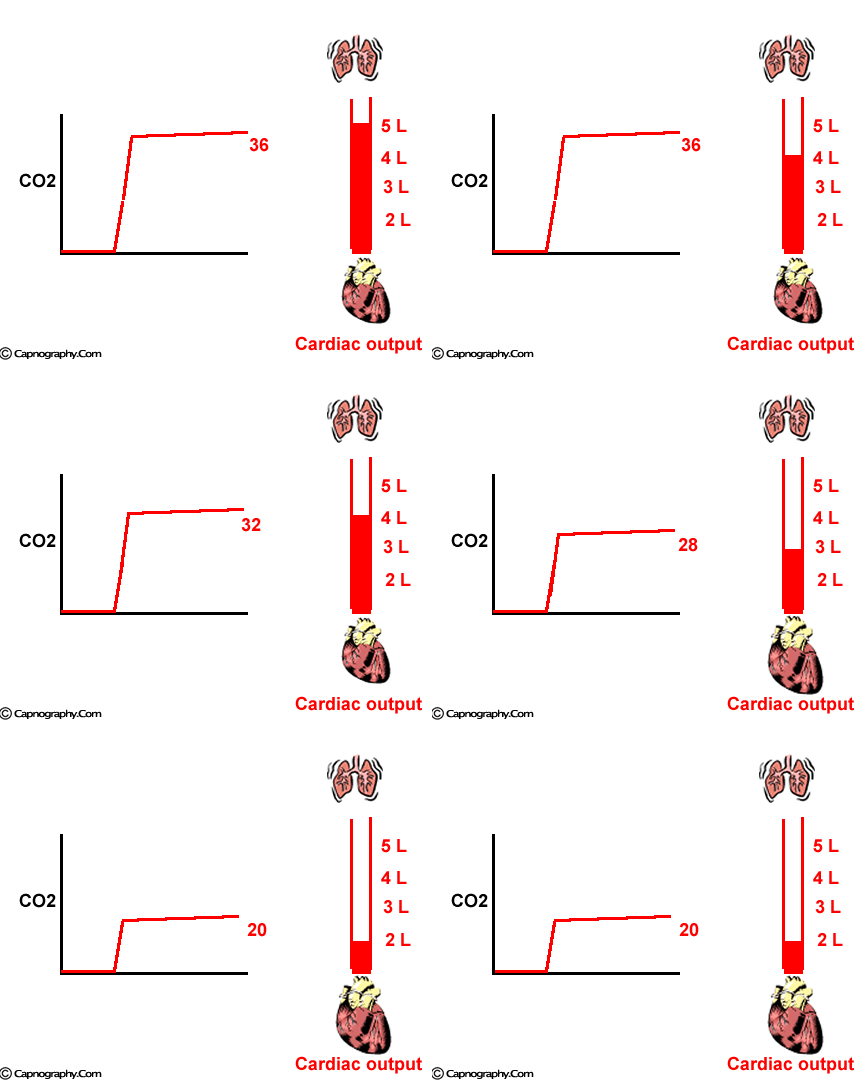
Data suggests that PetCO2 also correlated with coronary perfusion pressure (CPP) (8). It is also known to correlate with cerebral perfusion pressure and blood flow during CPR (9), but not with neurologic outcome. This correlation between perfusion pressure and ETCO2 is likely to be secondary to the relationship of PETCO2 and cardiac output.
Callaham M et al (10) used initial PetCO2 readings to predict return of spontaneous pulse during CPR. Patients who developed a pulse had a mean PetCO2 of 19 +/- 14 Torr at the start of resuscitation and those who did not had a mean PetCO2 of 5 +/- 4 Torr. Using an initial PetCO2 value of 15 torr identified 71% of the patients who were subsequently resuscitated with a specificity of 98%. PetCO2 value is not a sufficient criterion by itself for terminating resuscitation efforts.
Studies in animals and humans demonstrated that PetCO2 decreases when a large dose of epinephrine was used during CPR (11). Callaham M et al (12) in their study, report that epinephrine administration may decrease EtCO2 tensions in cardiac arrest, it does so unpredictably in individual patients and it does not eliminate the predictive value of this measurement. EtCO2 decreases an average 0.3 Torr after epinephrine administration. This decrease in EtCO2 has been attributed to increase in shunt fraction and also due to drop in cardiac output secondary to increased afterload by epinephrine (11). The duration of decrease in EtCO2 has not been quantified, but clinically can be useful for timing subsequent epinephrine dosing (13).
EtCO2 can be used as a feedback to optimize chest compressions during CPR (14). Monitoring PetCO2 during cardiac arrest may detect unrecognized CPR provider fatigue.
Other applications:
EtCO2 waveform analysis can give information of leaks in breathing circuit, airway obstruction (asthma, COPD). Refer to capno-magic screen.
Diagnosis of Pulmonary embolism. Refer to clinical applications.
Estimation of PaCO2 in mechanically ventilated patients: End-tidal PCO2 can be used to estimate arterial PaCO2 in patients with healthy lungs. For details refer to clinical section.
References:
1. Solazzi R W, Ward R J : The spectrum of medical liability cases. Int. Anesthesiol Clin 1984, 22:43.
2. Stewart R D, Paris P M, Winter P M :Field endotracheal intubation by paramedic personnel. Chest 1984, 85:341-345.
3. Ornato J P, Garnett A R, Glauser F L, Virginia R: Relationship between cardiac output and the end-tidal carbondioxide tension. Ann Emerg med 1990, 19: 1104-1106.
4. Ornato J P et al: Multicenter study of a portable, hand-size, colorimetric end-tidal carbondioxide detection device. Ann Emerg Med, May 1992; 21: 518-523.
5. Garnett A R, Germin C A, Germin A S: Capnographic wavefoms in esophageal intubations: effect of carbonated beverages. Ann Emerg Med 1989; 18:387-90.
6. Vukmir R B, Heller M B, Stein K L: Confirmation of endotracheal tube placement: A miniaturized infrared qualitative carbondioxide detector. Ann Emerg Med July 1991; 20:726-729.
7. White R D, Asplin B R: Out of hospital quantitative monitoring of end-tidal carbondioxide pressure during CPR. Ann Emerg Med January 1994; 23;25-30.
8. Sanders A B, Atlas M, Ewy G A et al: Expired PCO2 as an index of coronary perfusion pressure. Am J Emerg Med 1985; 3: 147-149.
9. Lewis L M, Sthothert J, Standeven J et al : Correlation of end-tidal carbondioxide to cerebral perfusion during CPR. Ann Emerg Med 1992; 21:1131-4.
10. Callaham M, Barton C: Prediction of outcome of CPR from end-tidal carbondioxide concentration. Crit Care Med 1990; 18:358-362.
11. Chase P B, Kern k B, Sanders A B et al: Effects of graded doses of epinephrine on both non invasive and invasive measures of myocardial perfusion and blood flow during cardio-pulmonary resuscitation. Crit care Med 1993; 21:413-9.
12. Callaham M, Barton C, Mathay M: Effect of epinephrine on the ability of end-tidal carbondioxide readings to predict initial resuscitation from cardiac arrest. Crit Care Med 1992; 20:337-343.
13. Ward k R, Yealy D M: End-tidal carbondioxide monitoring in emergency medicine, part2: Clinical applications. Academic Emergency Med 1998; 5: 637-646.
14. Kalenda Z: Capnogram as a guide to the efficacy of cardiac massage. Resuscitation 1978; 6:259-63.

 Twitter
 Youtube


