Physiology of capnography
Bhavani Shankar Kodali MD
Can Negative (a-ET)CO2 differences occur?
Where can they occur?
- Healthy subjects during low frequency high tidal volume ventilation
- Pregnant subjects
- Infants and Children
- After coming off cardiac bypass
- During and after exercise.
What are the reasons for negative values?
- Experimental errors
- Rebreathing
- Inadvertent addition of CO2 to the inspired gases
- Physiological reasons
Four physiological reasons
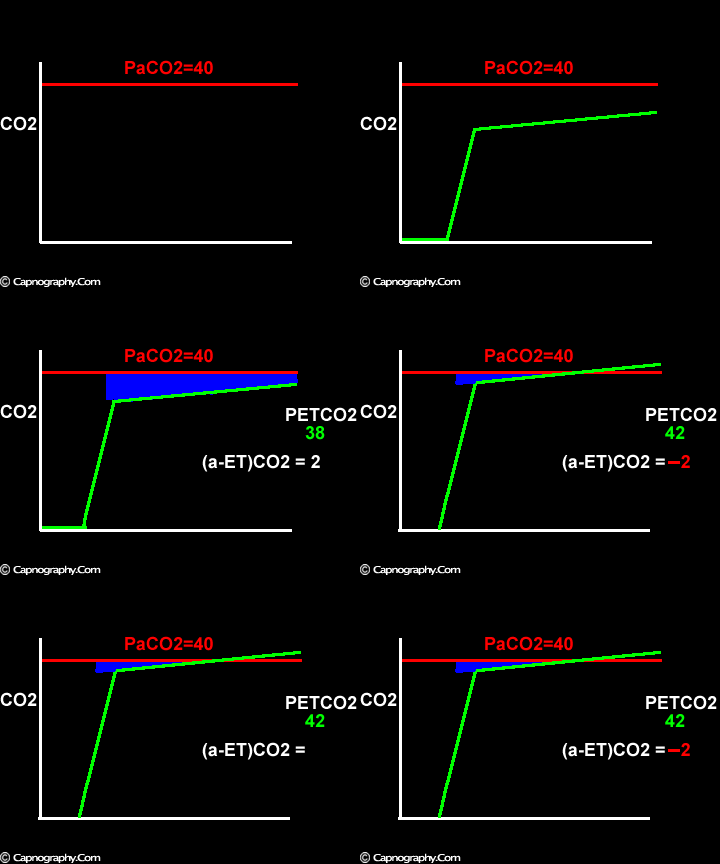
Smaller alveolar dead space and inherent upward slope of phase III
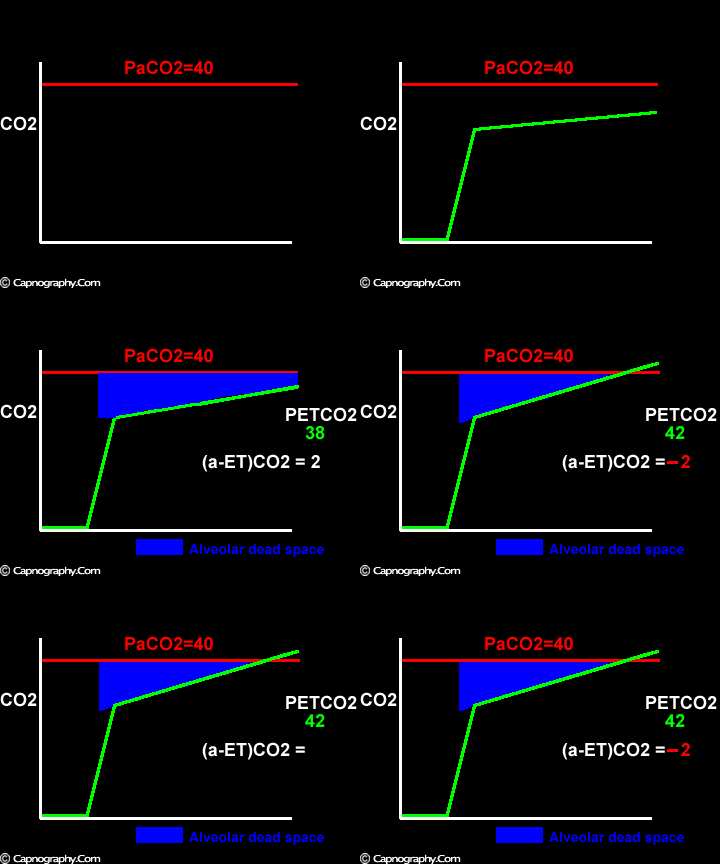
Increase in the slope of phase III
Exaggerated alveolar PCO2 fluctuations during respiratory cycle due to increased CO2 production and decreased FRC which make it more likely to sample higher alveolar PCO2 (sampled as PETCO2 ) during expiration greater than mean PaCO2
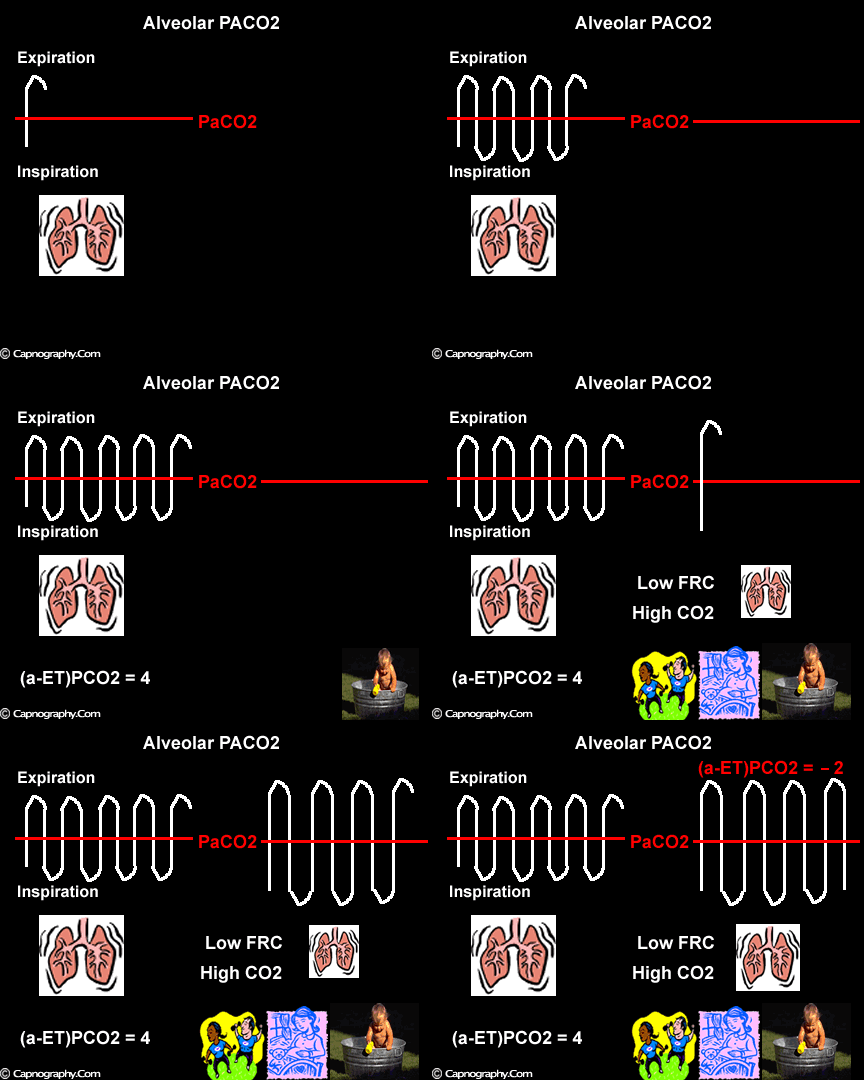
Occurrence of phase IV
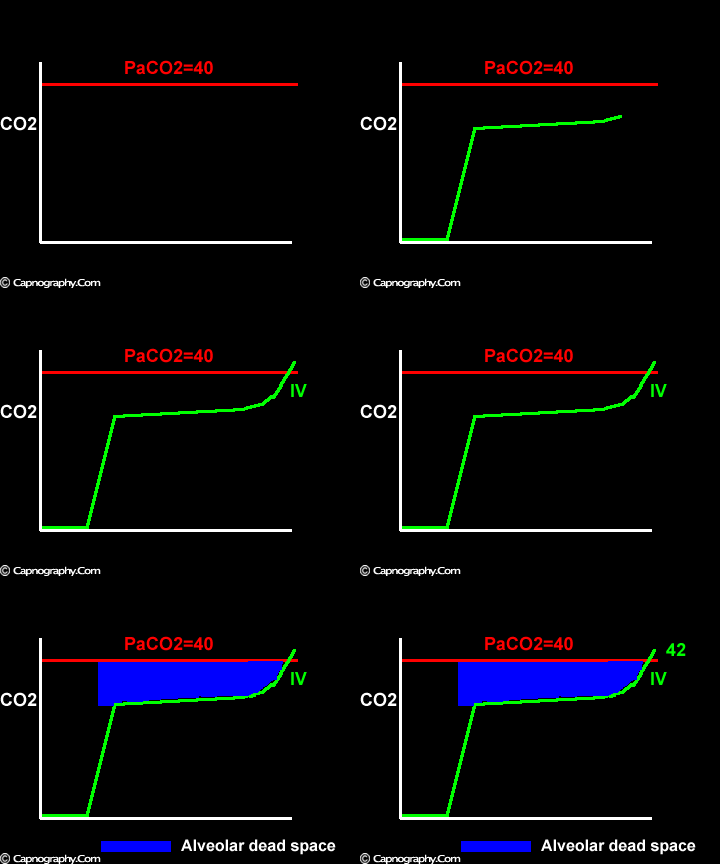
Negative (a-ET)PCO2 gradients:
Negative (a-ET)PC02 values were observed more than 30 yr ago by Nunn et al. during anesthesia although no explanation was offered.1 Fletcher et al. observed negative or zero (a-ET)PCO2 values in 12% of normal subjects during anesthesia and IPPV with large tidal volumes and low frequencies.2 Negative values were also observed during anesthesia in 50% of pregnant subjects,3 in 8.1% of patients after post-cardiac bypass (PCB)4 and in 50% of infants.5
Piper reviewed several studies with negative arterial to end-tidal CO2 differences in 1986 and concluded that the reasons for the remarkably pronounced disagreement between the experimental data of different studies cannot be definitely identified and suggested that it is desirable that more observational and experimental data become available in future to review this subject.6 Since then several studies have reported negative differences as stated above. The following possible mechanism have been postulated to explain observed (a-ET)PCO2 differences under various circumstances.
Large tidal volume and low frequency ventilation result in (i) better ventilation of dependent well-perfused alveoli which improves V/Q matching (small area of alveolar dead space as above in figure I). (ii) Gas emptying from slow alveoli to reach the mouth, whereas it would have remained in the airways with small frequent breaths. Under these circumstances the low V/Q areas (alveoli with higher PC02) make a more substantial contribution to the gas exchange. The net effect of these factors is to enable the terminal part of phase III to exceed mean PaC02, resulting in negative (a-ET)PC02.2
Alveolar PCO2 varies cyclically, being lowest at end-inspiration and highest at end-expiration. However, because of mixing in the heart and syringe, PaCO2 sampled at the radial artery is the spatial and temporal mean of alveolar PCO2 (Riley’s physiological integrator) and therefore it is quite possible for PETCO2 to exceed the sampled PaCO2. The increased cardiac output and increased C02 production, reduced FRC and low compliance associated with pregnancy may result in greater cyclical variations in alveolar PCO2 during a respiratory cycle and also in more alveoli with long time constants. During expiration, PACO2 increases towards PVC02 (partial pressure of mixed venous C02) more rapidly in pregnant subjects because a larger amount of C02 is evolved into a lung which becomes smaller as expiration continues. Further, pregnant subjects resemble the obese in some features namely reduced FRC and low total compliance and hence may exhibit a biphasic slope reminiscent of phase IV of the nitrogen closing volume test. The PC02 of most alveolar gas is less than PaC02 but, in the terminal part of the expirate, PC02 rises rapidly and may exceed PaC02. The combined effect of these two mechanisms increases the slope of phase III (Figure 4) and the likelihood of sampling a PETCO2 greater than PaC02.3,7-12 The presence of a wide range of V/Q mismatching and reduced FRC may result in negative (a-ET)PC02 values in patients after cardiopulmonary bypass.4,7 Increased C02 production and reduced FRC may be responsible for the negative (a-ET)PCO2 values observed in infants.5
References:-
1.Nunn JF, Hill DW. Respiratory dead space and arterial to end-tidal CO2 tension difference in anesthetized man. J Appl Physiol 1960;15:383-9.
2. Fletcher R, Jonson B. Deadspace and the single breath test for carbon dioxide during anaesthesia and artificial ventilation. Br J Anaesth 1984;56:109-19.
3. Shankar KB, Moseley H, Kumar Y, Vemula V. Arterial to end-tidal carbon dioxide tension difference during cesarean section anaesthesia. Anaesthesia 1986;41:698-702.
4. Russell GB, Graybeal JM, Strout JC. Stability of arterial to end-tidal carbon dioxide gradients during postoperative cardiorespiratory support. Can J Anaesth 1990;37:560-6.
5. Rich GF, Sconzo JM. Continuous end-tidal CO2 difference sampling within the proximal endotracheal tube estimates arterial CO2 tension in infants. Can J Anaesh 1991;38:201-3.
6. Piper Johannes. Blood-gas equilibrium of carbon dioxide in lungs: a continuing controversy. J. Appl Physiol 1986;60:1-8.
7. Shankar KB, Moseley H, Kumar Y. Negative arterial to end-tidal gradients. Can J Anaesth 1991;38:260-1.
8. Shankar KB, Moseley H, Kumar Y, Vemula V, Krishan A. Arterial to end-tidal carbon dioxide tension difference during anaesthesia for tubal ligation. Anaesthesia 1987;42:482-6.
9. Jones NL, Robertson DG, Kane JW. Differences between end-tidal and arterial PCO2 in exercise. J Appl Physiol 1979;47:954-60.
10. Fletcher R. Arterial to end-tidal CO2 tension differences. Anaesthesia 1987;42:210-1.
11.Bhavani-Shankar K, Moseley H, Kumar AY. Delph Y. Capnometry and anaesthesia. Can J Anaesth 1992;39:6:617-32.
12. Bhavani-Shankar K, Kumar AY, Moseley HSL, Hallsworth RA. Terminology and the current limitations of time capnography: A brief review. J Clin Monit 1995;11:175-82.

 Twitter
 Youtube


